

Testing – Anvil, PCMark Vantage & AIDA64
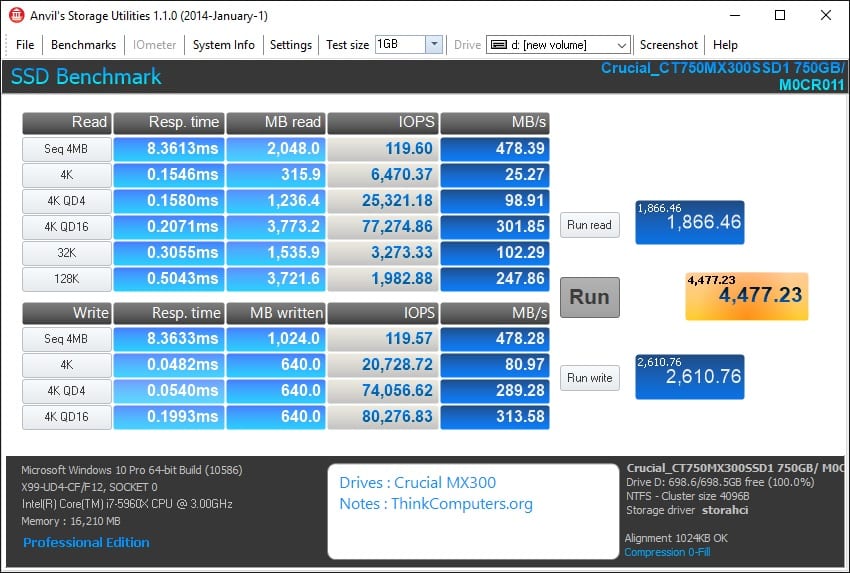
The next test is Anvil Storage Utilities, which is a really great piece of software. The SSD benchmark gives you scores for both read and write as well as a combined score.
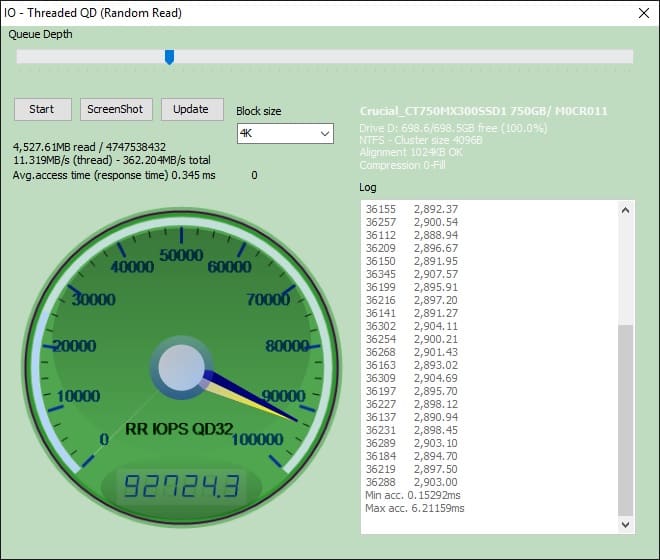
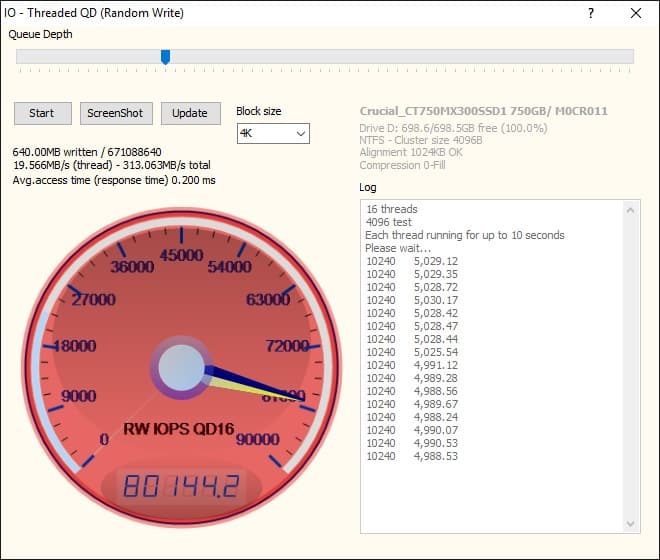
We also use Anvil to test IOPS. The Threaded Read and Write tests are great for this. On each one we set the QD to 32.
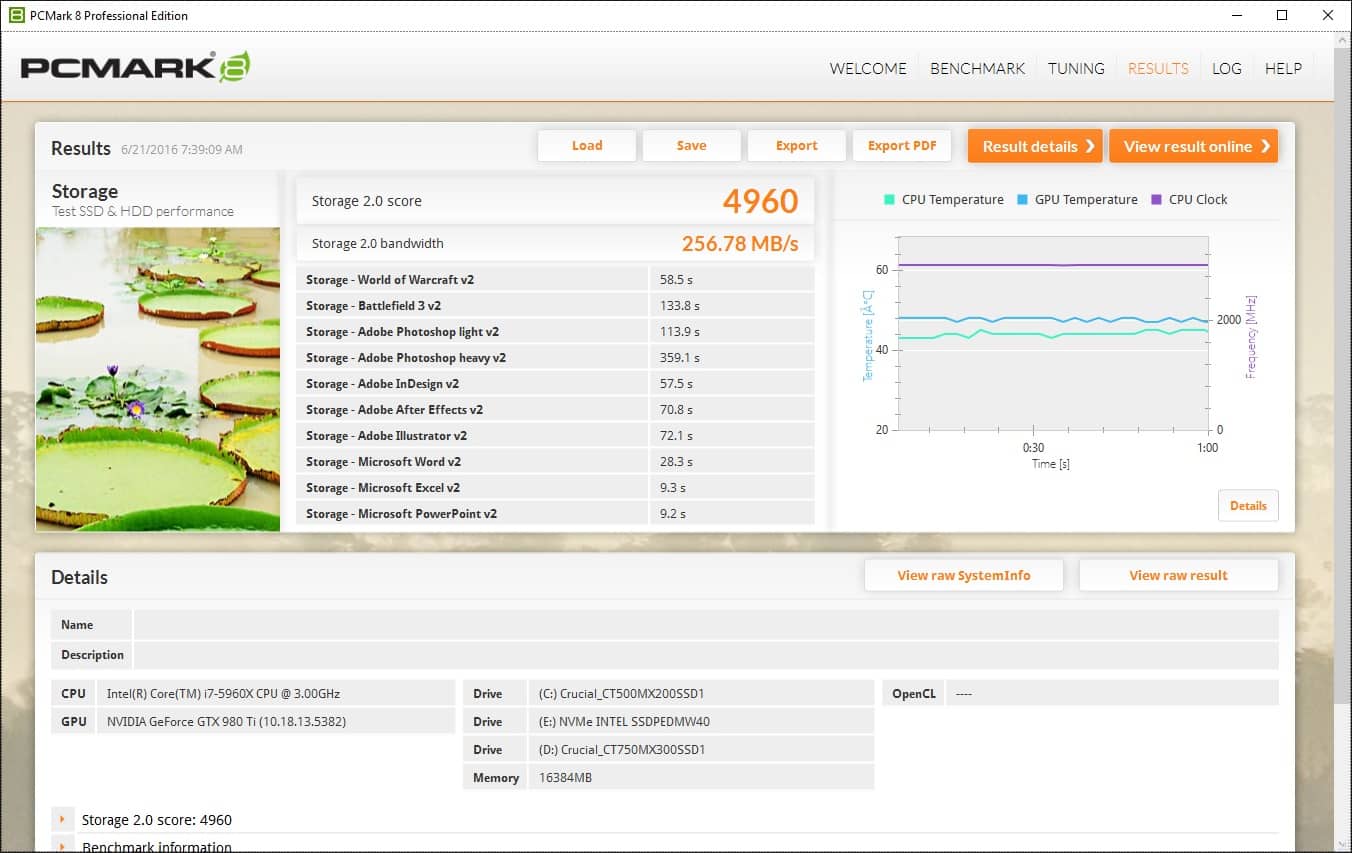
We have now added PCMark 8 to our solid state drive benchmarks. We first run the typical Storage Benchmark.
From there we move on to the Storage Consistency test that can only be run from the command line. More or less this test degrades the drive down to a “dirty” state and then brings it back up to a clean state after given time to recover and running background operations like garbage collection and TRIM. All of our other benchmarks show performance of the drive in a “clean” state so it is an interesting view to see how to drive functions in a “dirty” state and how well it recovers.
This test takes almost a full 24 hours to run and includes workload traces from Adobe Photoshop, Adobe Illustrator, Adobe InDesign, Adobe After Effects, Microsoft Word, Microsoft Excel, Microsoft PowerPoint, World of Warcraft and Battlefield 3.
The different phases of the test are explained below:
Precondition phase
– Write the drive sequentially through up to the reported capacity with random data.
– Write it through a second time (to take care of over-provisioning).
Degradation phase
– Run writes of random size between 8*512 and 2048*512 bytes on random offsets for 10 minutes.
– Run performance test (one pass only). The result is stored in secondary results with name prefix degrade_result_X where X is a counter.
– Repeat 1 and 2 for 8 times and on each pass increase the duration of random writes by 5 minutes
Steady state phase
– Run writes of random size between 8*512 and 2048*512 bytes on random offsets for final duration achieved in degradation phase.
– Run performance test (one pass only). The result is stored in secondary results with name prefix steady_result_X where X is a counter.
– Repeat 1 and 2 for 5 times.
Recovery phase
– Idle for 5 minutes.
– Run performance test (one pass only). The result is stored in secondary result with name recovery_result_X where X is a counter.
– Repeat 1 and 2 for 5 times.
Clean up
– Write the drive sequentially through up to the reported capacity with zero data.
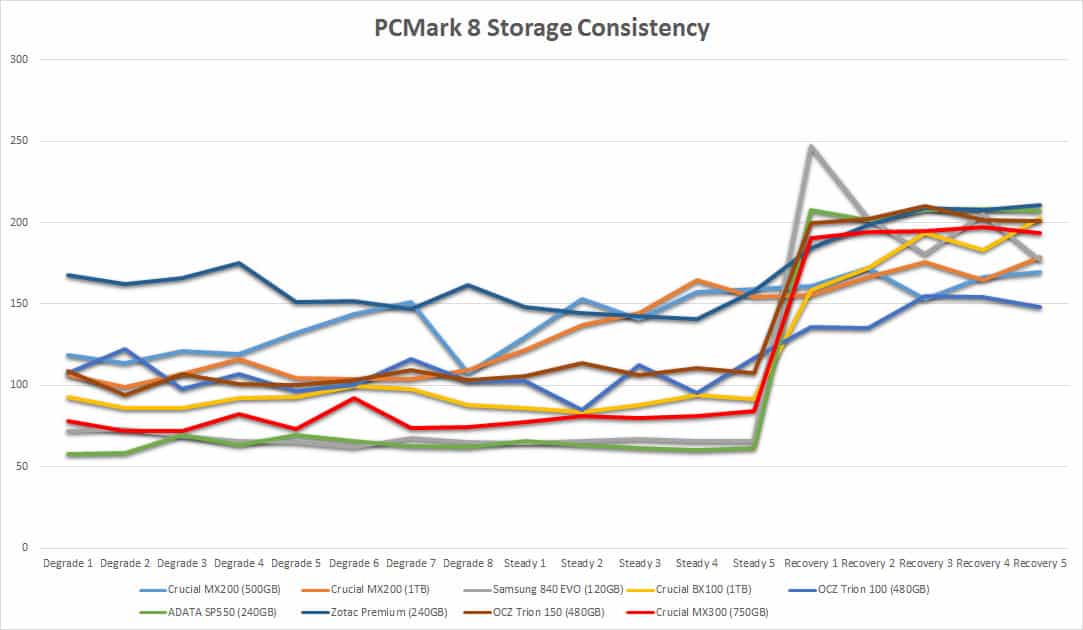
The drive does recover quite well.
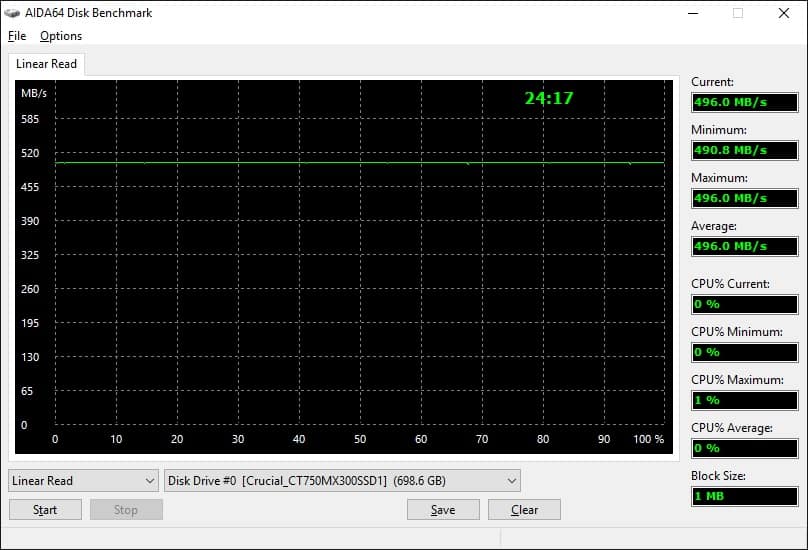
We have added back AIDA64’s Disk Benchmark to our testing. The linear tests will actually scan from the first physical sector to the last on the test drive. This gives a good representation of sustained read / write operations. We will be running the linear read and write tests using a 1MB block size.
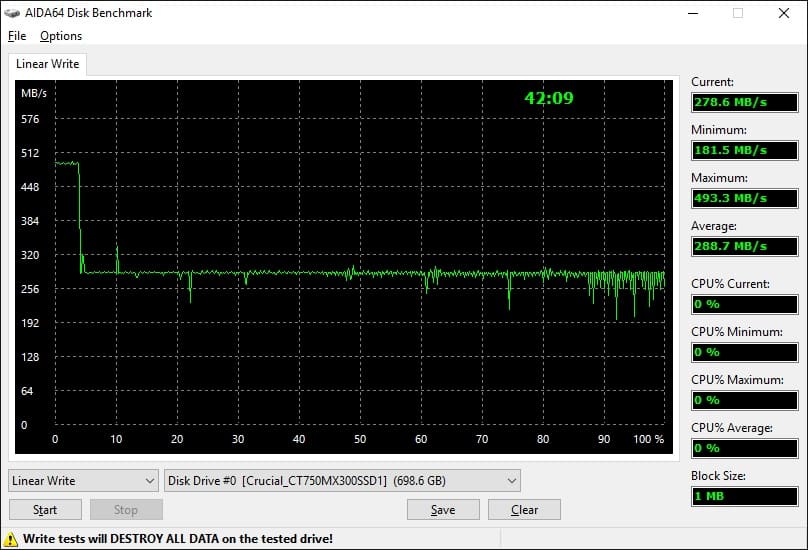
The write test will shows that SLC caching is being utilized. You can see while that drive starts out the write test at over 500 MB/s it drops down to around 288 MB/s. Our other tests do not show this as Crucial has done a good job with the Dynamic Write Acceleration on the drive and many of those tests have workloads that write in small bursts. So you should not see lower write speeds than this when doing large sequential transfers.